Failed to show chart
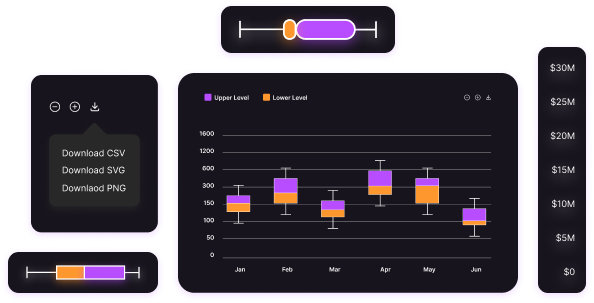
{"dick_boxplot_chart_child_0":{"data":{"x_axis_item":"Jan","y_axis_item_1":54,"y_axis_item_2":66,"y_axis_item_3":69,"y_axis_item_4":75,"y_axis_item_5":88}},"dick_boxplot_chart_child_1":{"data":{"x_axis_item":"Feb","y_axis_item_1":43,"y_axis_item_2":65,"y_axis_item_3":69,"y_axis_item_4":76,"y_axis_item_5":81}},"dick_boxplot_chart_child_2":{"data":{"x_axis_item":"Mar","y_axis_item_1":31,"y_axis_item_2":39,"y_axis_item_3":45,"y_axis_item_4":51,"y_axis_item_5":59}},"dick_boxplot_chart_child_3":{"data":{"x_axis_item":"Apr","y_axis_item_1":39,"y_axis_item_2":46,"y_axis_item_3":55,"y_axis_item_4":65,"y_axis_item_5":71}},"dick_boxplot_chart_child_4":{"data":{"x_axis_item":"May","y_axis_item_1":29,"y_axis_item_2":31,"y_axis_item_3":35,"y_axis_item_4":39,"y_axis_item_5":44}},"dick_boxplot_chart_child_5":{"data":{"x_axis_item":"Jun","y_axis_item_1":41,"y_axis_item_2":49,"y_axis_item_3":58,"y_axis_item_4":61,"y_axis_item_5":67}},"dick_boxplot_chart_child_6":{"data":{"x_axis_item":"Jul","y_axis_item_1":54,"y_axis_item_2":59,"y_axis_item_3":66,"y_axis_item_4":71,"y_axis_item_5":88}}}
