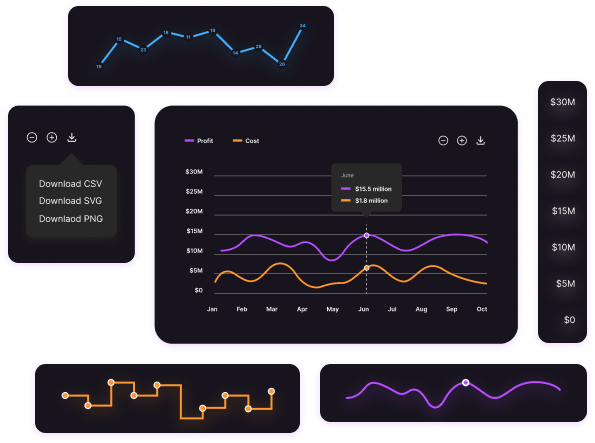
Line Chart
Visualize data trends and fluctuations over time with a Line Chart, offering a clear and smooth progression analysis.

Curve Line Chart
- A curve line chart smooths data connections gracefully
- It highlights trends and reduces visual noise
- Useful for tracking data over a time series
- Ideal for comparisons with elegant presentations
Straight Line Chart
- Displays data points connected by straight lines.
- Ideal for showing trends in time series.
- Simplifies data comparison with clear visuals.
- Best used for consistent, linear datasets.
Stepline Line Chart
- Connects data points with step-like lines.
- Useful for showing changes at intervals.
- Highlights abrupt shifts in data trends.
- Ideal for non-continuous or discrete datasets.
Monotone Cubic Line Chart
- Smooth curves ensure no overshooting data.
- Ideal for trends requiring natural flow.
- Maintains monotonicity in connected data points.
- Great for aesthetic and accurate presentations.
Double Stepline Line Chart
- Displays two step-like data series together.
- Useful for comparing discrete data changes.
- Highlights shifts between two related datasets.
- Ideal for tracking stepwise progress visually.