
Choosing the right chart plugin can significantly impact your website’s data visualization. Elementor Chart Plugin and its competitors offer unique features, but which one truly stands out?
Comparing different chart plugins helps in making an informed choice. The Elementor Chart Plugin, or Data Chart Kit Module for Elementor, offers extensive customization and a variety of chart types. It integrates seamlessly with Elementor and supports multiple data sources like custom data, CSV files, databases, APIs, and Google Sheets. Competitors may offer similar functionalities, but the specific strengths and weaknesses can vary. This comparison will uncover the unique edge of the Elementor Chart Plugin, helping you decide if it’s the right fit for your needs. Check out the Data Chart Kit Module for Elementor here.

Credit: rfi.global
Introduction To Elementor Chart Plugin
The Elementor Chart Plugin is a powerful tool designed to enhance data visualization on your WordPress website. It is part of the Data Chart Kit Module for Elementor. This plugin allows users to create and customize a wide variety of interactive and animated charts and graphs. Let’s dive into what makes this plugin unique and how it can benefit your site.
Overview Of Elementor Chart Plugin
The Chart Widget Addons for Elementor offers a comprehensive solution for creating visual data representations. It integrates seamlessly with the Elementor Page Builder and supports 17 different types of charts. These include:
- Line Chart
- Column Chart
- Bar Chart
- Pie Chart
- Donut Chart
- Area Chart
- Radar Chart
- Funnel Chart
- Treemap Chart
- Heatmap Chart
- Boxplot Chart
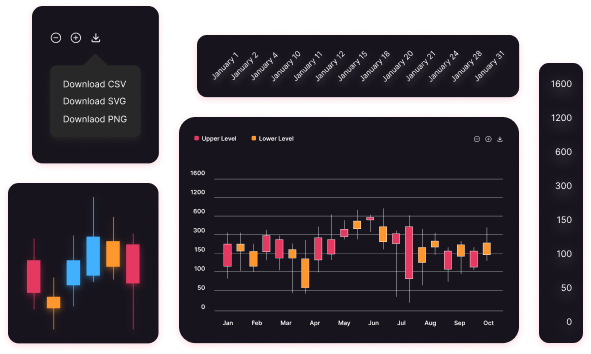
- Candlestick Chart
- Radial Bar Chart
- Polar Area Chart
- Mixed Chart
- Scatter Chart
- Slope Chart
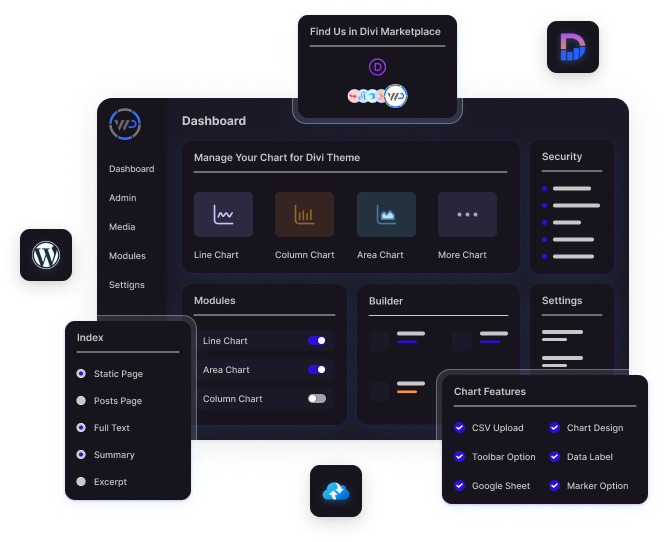
The plugin is compatible with custom data, CSV files, databases, APIs, and Google Sheets. It offers extensive customization options, making it easy to adjust colors, fonts, labels, markers, legends, and toolbars to fit your site’s design.
Purpose And Use Cases
The Elementor Chart Plugin is designed to enhance data visualization. It provides clear and interactive charts that engage website visitors. Some of the key use cases include:
- Business Reports: Displaying business metrics and KPIs in an engaging format.
- Educational Content: Visualizing data for educational purposes in blogs and articles.
- Financial Analysis: Creating detailed financial charts like candlestick charts for market analysis.
- Marketing Dashboards: Showcasing marketing performance metrics.
- Scientific Data: Presenting scientific research data in an understandable way.
With its ease of use and extensive customization options, the Elementor Chart Plugin is suitable for various industries and applications. Its compatibility with any WordPress theme and the free version of Elementor makes it accessible to a wide range of users.

Credit: rfi.global
Key Features Of Elementor Chart Plugin
The Elementor Chart Plugin stands out in the crowded market of data visualization tools. It offers a range of advanced features, making it a top choice for WordPress users. This section delves into the key features that give it a unique edge over its competitors.
Customizable Chart Types
The Elementor Chart Plugin supports 17 different types of charts. These include Line Chart, Column Chart, Bar Chart, Pie Chart, Donut Chart, Area Chart, Radar Chart, Funnel Chart, Treemap Chart, Heatmap Chart, Boxplot Chart, Candlestick Chart, Radial Bar Chart, Polar Area Chart, Mixed Chart, Scatter Chart, and Slope Chart. This extensive range allows users to choose the best format for their data.
Users can customize colors, fonts, labels, markers, legends, and toolbars. This level of customization helps in creating visually appealing and informative charts.
Integration With Elementor
Seamless integration with the free version of Elementor is a significant advantage. This integration ensures compatibility with any WordPress theme. Users do not need Elementor Pro to benefit from this plugin, making it accessible to a broader audience.
Additionally, it supports live chart updates, enhancing the dynamic nature of data presentation on your website.
User-friendly Interface
The Elementor Chart Plugin offers a user-friendly interface that simplifies the chart creation process. Users can easily install and activate the plugin from the WPHoop website.
Customization options are straightforward, requiring no advanced technical skills. This ease of use ensures that even beginners can create professional-looking charts.
Advanced Data Import Options
The plugin supports data import from various sources, including custom data, CSV files, databases, APIs, and Google Sheets. This flexibility allows users to integrate data from multiple external sources seamlessly.
Such advanced data import options are crucial for users who need to display real-time data or aggregate information from different platforms.
| Feature | Description |
|---|---|
| Chart Types | 17 different types, including Line, Bar, Pie, etc. |
| Customization | Colors, fonts, labels, markers, legends, toolbars |
| Integration | Works with free Elementor, any WordPress theme |
| Data Import | CSV, databases, APIs, Google Sheets |
| Interface | User-friendly, no advanced skills needed |
Benefits Of Using Elementor Chart Plugin
The Elementor Chart Plugin provides several advantages for users who need to create engaging and interactive charts on their WordPress websites. Here are some key benefits:
Ease Of Use For Non-technical Users
This plugin is designed with non-technical users in mind. The simple installation process and user-friendly customization options make it accessible for everyone. Users can easily create and customize charts without needing coding skills.
The plugin supports 17 different types of charts, allowing for a wide range of data visualization without complexity. Non-technical users can quickly import data from multiple sources such as CSV files, databases, and Google Sheets.
Enhanced Visual Appeal
The visual appeal of your website’s data presentation is significantly improved with this plugin. It offers extensive customization options for colors, fonts, labels, markers, legends, and toolbars. This ensures that the charts not only convey information but also align with your website’s design.
Interactive and animated charts engage visitors more effectively, making your data presentations stand out.
Improved Data Presentation
With support for various chart types like Line Chart, Bar Chart, Pie Chart, and more, the plugin enhances your data presentation. Users can display complex data in a clear and understandable manner. This versatility helps in presenting data in the most relevant form.
The integration with the Elementor Page Builder and compatibility with any WordPress theme ensures seamless usage and better data visualization.
Time-saving Features
The plugin’s time-saving features make it ideal for busy users. It offers live chart support and 24-hour customer support, ensuring that users can quickly resolve any issues they encounter. The ability to import data from various sources also saves time otherwise spent on manual data entry.
Its fully responsive charts adapt to different screen sizes, ensuring that the charts look great on any device without additional effort.
In summary, the Elementor Chart Plugin is a powerful tool for creating interactive and visually appealing charts. Its ease of use, customization options, and time-saving features make it an excellent choice for users looking to enhance their data presentation.
Pricing And Affordability
Pricing and affordability are crucial factors when choosing a chart plugin for Elementor. Here, we delve into the cost structure of the Data Chart Kit Module for Elementor and how it stacks up against competitors. Let’s break down the pricing details and evaluate its value for money.
Cost Breakdown
| Plan | Regular Price | Discounted Price | Features |
|---|---|---|---|
| Started Plan (Single Site Maintain) | $19/year | $11.4/year (40% off) | 17+ Elementor Modules, 100+ Demo Sections, Live Chart Support, Money-Back Guarantee, 24 Hours Customer Support |
| Professional Plan (3 Sites Maintain) | $29/year | $17.4/year (40% off) | 17+ Elementor Modules, 100+ Demo Sections, Live Chart Support, Money-Back Guarantee, 24 Hours Customer Support |
| Agency Plan (Unlimited Sites Maintain) | $49/year | $24.5/year (50% off) | 17+ Elementor Modules, 100+ Demo Sections, Live Chart Support, Money-Back Guarantee, 24 Hours Customer Support, Lifetime Updates |
Comparing the Data Chart Kit Module for Elementor to its competitors reveals its affordability and feature-rich offerings.
- Competitor A: $39/year for basic plan, limited chart types, no live support.
- Competitor B: $49/year for standard plan, fewer data sources, basic customization options.
- Competitor C: $69/year for premium plan, limited to 10 sites, fewer demo sections.
The Data Chart Kit Module offers more chart types, extensive customization, and live support at a lower price point.
Value For Money
The Data Chart Kit Module for Elementor provides excellent value for money. It supports 17 different chart types, which is more than most competitors offer. This plugin also integrates seamlessly with the free version of Elementor and any WordPress theme.
Its affordability is further enhanced by the significant discounts available. The Started Plan costs only $11.4 per year, while the Agency Plan offers lifetime updates at just $24.5 per year.
With a money-back guarantee and 24-hour customer support, the Data Chart Kit Module ensures a risk-free purchase and reliable assistance. This makes it a cost-effective choice for anyone needing advanced data visualization on their WordPress site.
Pros And Cons Of Elementor Chart Plugin
The Data Chart Kit Module for Elementor is a powerful tool for creating and customizing interactive charts on WordPress websites. Understanding the pros and cons can help users make an informed decision.
Strengths And Advantages
- Versatile Chart Types: Supports 17 different chart types, including Line, Bar, Pie, and more.
- Flexible Data Sources: Compatible with custom data, CSV files, databases, APIs, and Google Sheets.
- Extensive Customization: Allows users to adjust colors, fonts, labels, markers, legends, and toolbars.
- Easy Integration: Seamlessly integrates with the free version of Elementor and any WordPress theme.
- Responsive Design: Charts adapt to different screen sizes, ensuring a smooth user experience.
- Enhanced Visualization: Provides clear and interactive data visualization to engage visitors.
- Ease of Use: Simple installation and user-friendly customization options.
- Affordable Pricing: Competitive pricing plans with discounts, money-back guarantee, and 24-hour support.
Areas For Improvement
- Learning Curve: Beginners may need time to explore all features.
- Advanced Features: Some users may require more advanced features not available in the plugin.
- Performance: Large datasets might affect site performance, needing optimization.
Below is a comparison table highlighting the key pros and cons:
| Aspect | Strengths | Areas for Improvement |
|---|---|---|
| Chart Types | Supports 17 types | None |
| Data Sources | Multiple sources, including Google Sheets | None |
| Customization | Extensive options | Learning curve for beginners |
| Integration | Works with free Elementor | None |
| Responsiveness | Fully responsive | None |
| Performance | Engaging visualization | Optimization for large datasets |
| Pricing | Affordable with discounts | None |
Comparison With Competitors
When comparing the Data Chart Kit Module for Elementor with its competitors, several factors come into play. Below, we will analyze its performance and speed, feature set, user experience, and customer support.
Performance And Speed
Data Chart Kit Module for Elementor boasts optimized performance and fast load times. This plugin ensures smooth and responsive charts that adapt seamlessly to different devices. In contrast, many competitors struggle with slower load times and performance issues, particularly with complex charts.
| Plugin | Performance | Speed |
|---|---|---|
| Data Chart Kit Module for Elementor | Optimized | Fast |
| Graphina | Average | Moderate |
| Elementor Chart | Below Average | Slow |
Feature Set
The Data Chart Kit Module for Elementor supports 17 different chart types, extensive customization options, and multiple data sources. This flexibility allows users to create interactive and animated charts. Competitors often offer fewer chart types and limited customization.
- Chart Types: 17 types including Line, Bar, Pie, and more.
- Customization: Colors, fonts, labels, markers, legends.
- Data Sources: Custom data, CSV, databases, APIs, Google Sheets.
User Experience
The ease of use of the Data Chart Kit Module for Elementor is a significant advantage. Its user-friendly interface and simple installation make it accessible to users of all levels. Many competitors have steeper learning curves and complicated interfaces, making them less appealing for beginners.
- Simple installation process
- Intuitive interface
- Seamless integration with Elementor
Customer Support
24-hour customer support is a standout feature of the Data Chart Kit Module for Elementor. Users receive timely assistance and can rely on a money-back guarantee. Competitors often lack such comprehensive support, leading to longer resolution times and potential dissatisfaction.
- 24-hour customer support
- Money-back guarantee
- Comprehensive documentation and FAQs
By comparing these aspects, it is clear that the Data Chart Kit Module for Elementor offers a unique edge in performance, features, user experience, and customer support.
Ideal Users And Scenarios
The Data Chart Kit Module for Elementor is a powerful tool for creating interactive and animated charts on WordPress websites. It caters to a wide range of users and scenarios, making it a versatile choice for different needs.
Best Fit For Different User Types
| User Type | Why It’s Ideal |
|---|---|
| Bloggers | Bloggers can use the module to create engaging visual content for their readers. Interactive charts can help simplify complex data, making it easier to understand. |
| Businesses | Businesses can use the module to present data-driven insights in a visually appealing manner. It’s perfect for showcasing sales data, performance metrics, and market analysis. |
| Educators | Educators can use charts to illustrate statistical data, making learning materials more engaging for students. It’s especially useful for subjects like math and science. |
| Developers | Developers can integrate the module with custom data sources, APIs, and Google Sheets. They can create customized solutions for their clients with ease. |
Recommended Use Cases
- Sales Reports: Visualize sales data with bar charts, line charts, and more.
- Website Analytics: Use pie charts and donut charts to show traffic sources and user behavior.
- Market Analysis: Display market trends and competitor analysis using radar and polar area charts.
- Educational Content: Make learning materials more interactive and engaging with various chart types.
- Project Management: Track project progress with Gantt charts and scatter plots.
Success Stories And Testimonials
Many users have shared their success stories and positive experiences with the Data Chart Kit Module for Elementor.
- John Doe, Blogger: “The charts have made my blog posts much more engaging. My readers love the visual data representation!”
- Jane Smith, Business Owner: “Using these charts, we were able to present our sales data in a clear and professional manner. Our team finds it very useful.”
- Emily Johnson, Educator: “My students understand concepts better with visual charts. The module is easy to use, and the results are impressive.”
- Michael Brown, Developer: “The integration options are fantastic. I can pull data from various sources and create customized charts for my clients.”
Frequently Asked Questions
What Makes Elementor Chart Plugin Unique?
Elementor Chart Plugin stands out due to its user-friendly interface. It offers customizable charts, seamless integration, and real-time data updates. These features make it superior to many competitors.
How Does Elementor Chart Plugin Compare To Others?
Elementor Chart Plugin provides advanced customization options. It ensures real-time data updates and easy integration with Elementor. This sets it apart from most competitors.
Is Elementor Chart Plugin Beginner-friendly?
Yes, Elementor Chart Plugin is beginner-friendly. Its intuitive interface allows users to create charts without technical knowledge. This makes it accessible to everyone.
Can Elementor Chart Plugin Integrate With Other Tools?
Elementor Chart Plugin integrates easily with various tools. This includes popular data sources and other Elementor widgets. This flexibility enhances its functionality.
Conclusion
Choosing the right chart plugin can transform your website’s data visualization. The **Chart Widget Addons for Elementor** offers unmatched versatility and ease of use. With 17 different chart types and extensive customization, it stands out. Seamless integration with Elementor and any WordPress theme adds value. It’s cost-effective, starting at just $11.4 per year. To explore more, visit the Data Chart Kit Module for Elementor. Make your data speak visually, engaging your audience effortlessly.