
Creating visually appealing and interactive charts is vital for effectively communicating data and engaging website visitors. With the Elementor Chart Plugin, this process becomes intuitive and efficient. This article will guide you through everything you need to know to integrate and optimize this plugin into your website design.
Understanding the Elementor Chart Plugin: A Brief Overview
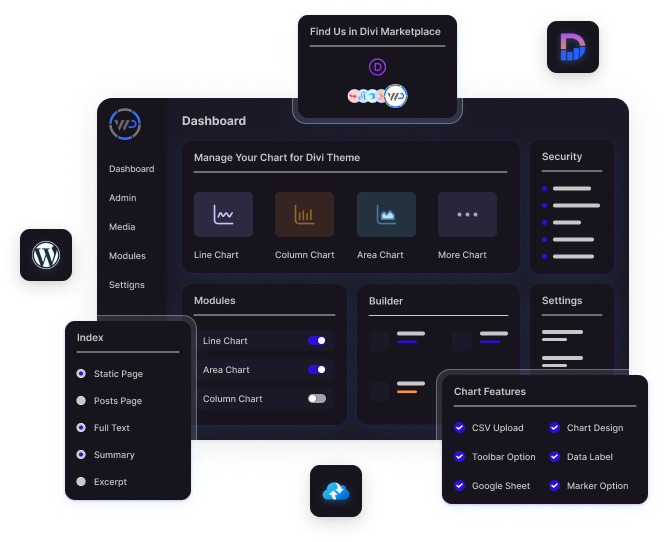
What Is the Elementor Chart Plugin?
The Elementor Chart Plugin is a dynamic WordPress tool designed for creating and embedding interactive charts within websites built using Elementor. It allows users to visualize data in various formats, including bar graphs, pie charts, line graphs, and more, without requiring any coding skills.
Key Features and Benefits of Using the Plugin
- Ease of Use: seamless drag-and-drop interface integrated with Elementor.
- Multiple Chart Types: Options include bar, line, radar, pie, and doughnut charts.
- Customizability: Adjust colors, labels, and animations to suit your website’s branding.
- Responsiveness: Charts automatically adapt to mobile and tablet devices.
- Data Import: Supports data import from external sources like CSV files.
- Enhanced User Engagement: Interactive features like tooltips and hover effects improve user interaction.
Preparing Your Website for Plugin Integration
Ensuring Compatibility with Your Current Theme and Plugins
Before installing the Elementor Chart Plugin, ensure that your WordPress theme and other plugins are compatible. Check for:
- Elementor’s compatibility with the plugin version.
- Any conflicts with existing chart or visualization plugins.
- Minimum PHP version requirements.
Backing Up Your Website Before Integration
To prevent data loss during installation, perform a full website backup:
- Use a WordPress backup plugin like UpdraftPlus or BackupBuddy.
- Save backups locally or on cloud storage.
- Verify that the backup includes all database files and media content.
How to Install and Set Up the Elementor Chart Plugin
Step-by-Step Installation Guide
- Download the Plugin: Visit Elementor Chart Plugin and download the latest version.
- Upload to WordPress: Navigate to Plugins > Add New > Upload Plugin in your WordPress dashboard.
- Activate the Plugin: After installation, click the Activate button.
- Verify Installation: Ensure the plugin appears in your Elementor widgets panel.
Initial Configuration and Settings
- Access the plugin’s settings via Elementor > Settings > Chart Plugin.
- Configure global settings, including default colors, fonts, and data sources.
- Enable advanced features like animation and interaction effects.
Designing Charts That Engage and Inform Visitors
Choosing the Right Chart Type for Your Data
Selecting the appropriate chart type depends on the nature of your data:
- Bar Charts: Ideal for comparing categories.
- Line Charts: Best for showing trends over time.
- Pie Charts: Perfect for displaying proportions.
Customizing Chart Colors, Fonts, and Styles
- Use contrasting colors to enhance readability.
- Select fonts that align with your site’s typography.
- Experiment with animation settings to make charts visually dynamic.
Advanced Features of the Elementor Chart Plugin
Interactive Chart Options: Adding Animation and Hover Effects
Interactive charts can captivate your audience. Add:
- Animations: Smooth transitions that highlight data points.
- Hover Effects: Tooltips displaying additional data when users hover over a chart element.
Importing Data from External Sources
Streamline chart creation by importing data:
- Format your data in a CSV or JSON file.
- Upload the file in the plugin’s data import section.
- Map fields to chart labels and values.
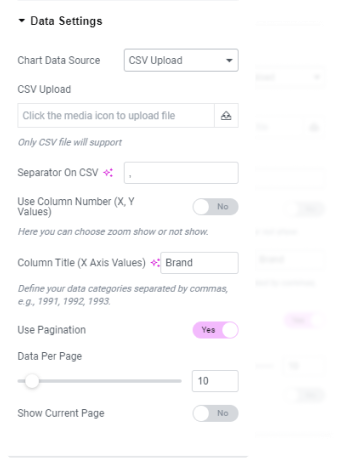
Chart Plugin
Best Practices for Optimizing Chart Performance
Reducing Load Times for Complex Charts
- Compress data files before uploading.
- Limit the number of simultaneous animations.
- Use caching plugins like WP Rocket to speed up chart loading.
Ensuring Mobile Responsiveness
- Test charts on multiple devices using Elementor’s responsive mode.
- Adjust dimensions to ensure visibility on smaller screens.
Troubleshooting Common Issues with the Plugin
Resolving Display Errors
- Clear your browser and server cache.
- Update Elementor and the plugin to the latest versions.
- Check for JavaScript console errors in your browser.
Plugin Conflicts: How to Identify and Fix Them
- Deactivate other plugins one by one to identify conflicts.
- Reach out to the Elementor Chart Plugin support team for assistance.
Frequently Asked Questions About the Elementor Chart Plugin
Can I Use the Plugin with Any WordPress Theme?
Yes, the Elementor Chart Plugin is compatible with most modern WordPress themes that support Elementor.
Are There Limitations on the Types of Charts I Can Create?
The plugin offers a wide range of chart types, but certain niche formats may require additional customization.
How Secure Is the Elementor Chart Plugin?
The plugin adheres to WordPress security standards, ensuring data integrity and user safety.
Conclusion and Final Thoughts
Integrating the Elementor Chart Plugin into your website design can transform the way you present data, making it visually engaging and easy to understand. By following these tips, you can unlock the plugin’s full potential and provide your audience with a seamless and interactive experience.